Login Book a Demo

Spreadsheets tell you who's overbooked a month too late. ProjexHQ shows it now — across every project — and lets you fix it safely. Rebalance in a sandbox, see the impact on everyone's load, and apply the change to the plan only when it works.

See it, then drill in

Overallocation stops being a surprise when it's right there on the grid.

Utilization heat map, with drill-down

A portfolio-wide grid of who's over or under capacity, week by week or month by month. Click any cell to see the exact projects and tasks behind the number — and open that person's full profile without leaving the view.
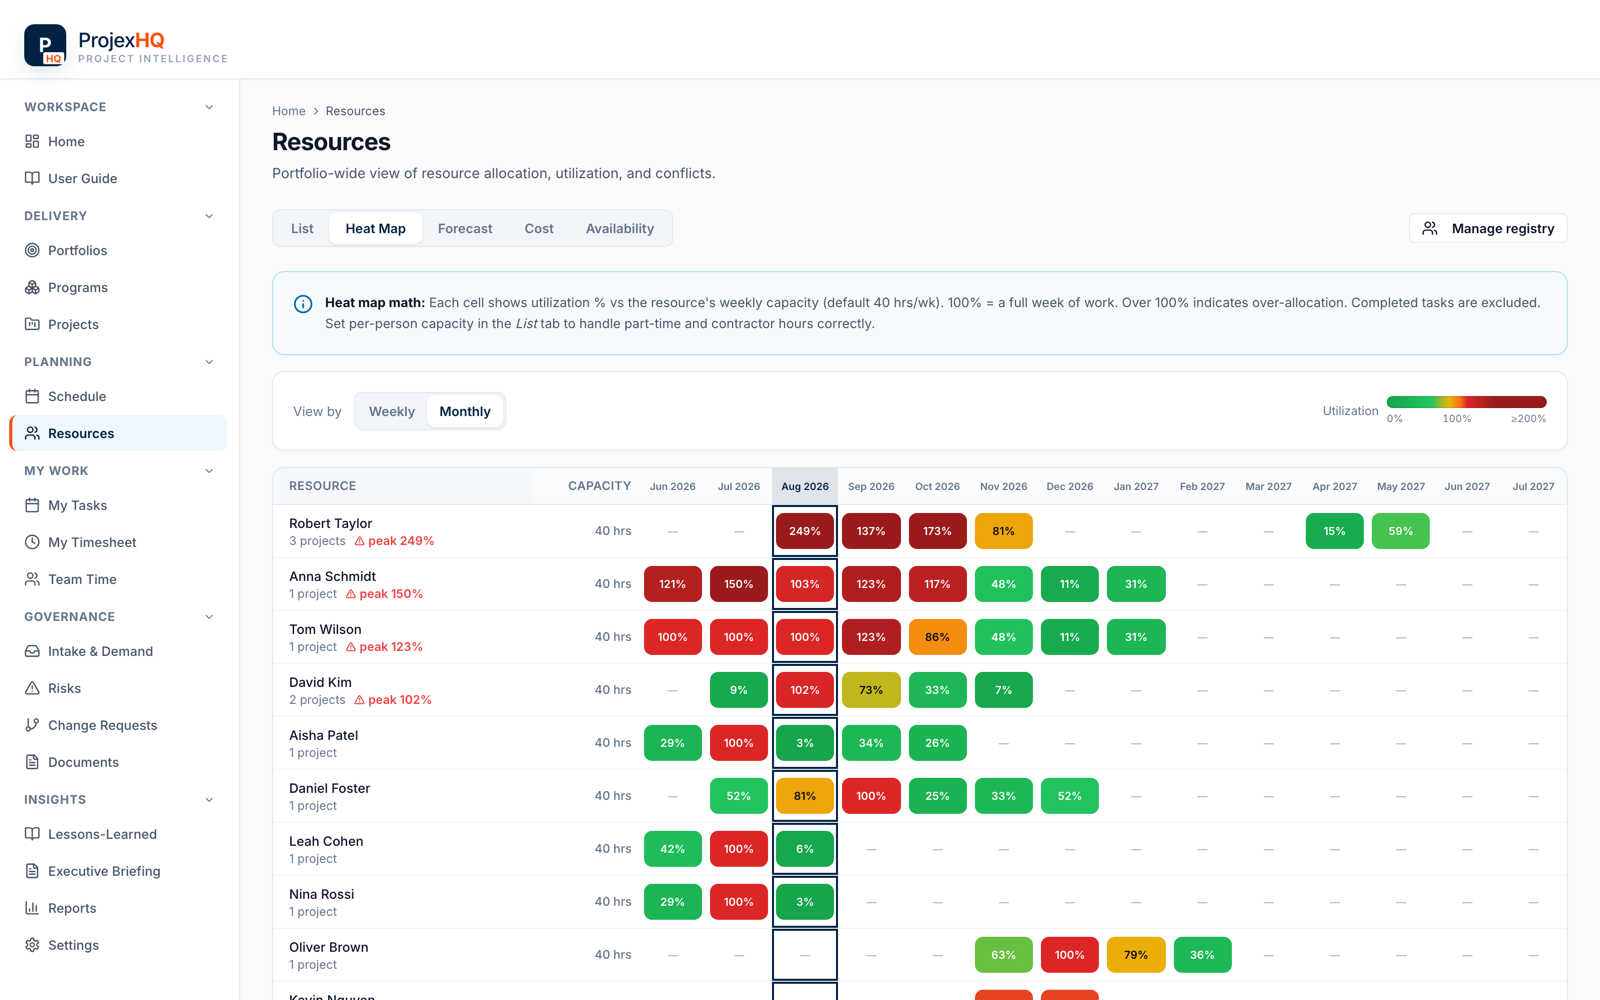
ProjexHQ resource utilization heat map

What-if scenarios — model before you commit Pro

Reduce, remove, or reassign people in a scenario and watch the impact on peak utilization update instantly. Happy with it? Apply to the plan in one step. Not yet? Nothing changed.
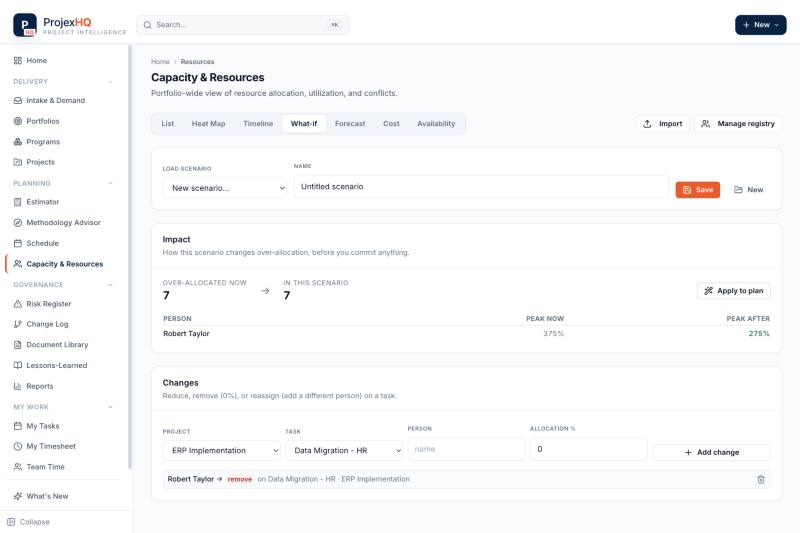
ProjexHQ what-if scenario impact table showing peak utilization before and after a reassignment

Rebalance safely

Every what-if runs in a sandbox. See the impact on the whole team, then apply to the plan only when the numbers work — no bulk-undo roulette.

Plan ahead, not just today

Catch the shortfall — and the single points of failure — while you still have time to act.

Skills coverage & single points of failure

Tag each person's skills and instantly see where only one person covers a critical capability — before they take vacation.

Capacity vs. demand forecast

Project future demand from your roadmap against real capacity, and see where you'll be short — by role — in time to hire or re-sequence.

Cost & utilization trend

Roll utilization up into cost, and track planned utilization over time from weekly snapshots to catch creeping overload.

Time off & holidays count

Capacity reflects who's actually available — personal time off and company holidays reduce it automatically, so plans stay honest.

Map your team's capacity

Start your 14-day free trial. No credit card required.

Start Free Trial

Explore AI Portfolio Intelligence →